Causal Map is a web app for causal mapping: coding the causal claims in what people say (this led to that), by hand or with AI, and joining them into a map of how they think change happened. If you run surveys with open-ended questions, Causal Map turns the answers you have not had time to analyse into evidence about what respondents say caused the changes they saw, which you can compare across the groups recorded in your closed questions.
It reads the exports of KoboToolbox, ODK, SurveyCTO, Google Forms, Microsoft Forms, Qualtrics and SurveyMonkey, and any other spreadsheet with one row per respondent.
- Sign up free at app.causalmap.app. No credit card is needed. The Free plan has unlimited projects and coding, and a monthly allowance of credits for the AI features, AI coding included.
- Free projects are public: anyone with the link can view them. For survey responses that are not fit to publish, you need a paid plan, starting with Private (from £18 a month): see pricing and the privacy notes below.
- To get a survey in, export the responses from your survey tool as XLSX or CSV, upload the file to Causal Map, check what the import guessed each column to be, and press Import. The steps for each tool are below.
Why code the open answers for causes#
Most survey analysis stops at the closed questions. They go straight into a chart. The answers to "What has changed?" and "Why?" often stay in the export, since reading several hundred of them and making sense of them by hand takes days. Yet those are the answers in which respondents explain, in their own words, what led to what.
Causal Map reads each answer for exactly that: the causal claims in it. Most AI features in survey tools do something else with open answers. They sort each answer into themes or summarise it, as KoboToolbox's own AI analysis now does for audio responses. Causal coding keeps the connections. Each claim becomes a link from one factor to another. From these you can see which causes respondents mention most, follow the pathways from a project's activities to its outcomes, and count how many respondents describe each step.
Exporting the responses from your survey tool#
Each of these tools exports one row per respondent. Download the responses as XLSX (Excel) or CSV.
KoboToolbox#
- Open your project and go to DATA > Downloads. Choose XLS or CSV.
- Under Value and header format, choose Labels if you want the question wording as column names in Causal Map, or XML values and headers for the shorter question names.
- Only the XLS export includes repeat groups, each on a sheet of its own. Causal Map reads the first sheet, so answers inside repeat groups are not imported.
ODK Central#
- On the form's submissions page, click Download all # records and choose CSV.
- You get a .zip file. Unzip it and upload the .csv named after your form title. The other .csv files contain the repeat groups, which are not imported.
SurveyCTO#
- On the server console's Export tab, download your data as .csv or .xlsx.
- If your form has repeat groups, a wide-format export puts them in the main sheet as numbered columns (such as
age_1andage_2), and each is imported as a column of its own. A long-format export puts each repeat group in a sheet or file of its own, which is not imported.
Google Forms#
- Open the form, click Responses, then More and Download responses (.csv).
- If the responses go to a linked Google Sheet, you can download the sheet instead, with File > Download.
- The export does not include a respondent ID, so respondents are numbered in the order of the file.
Microsoft Forms#
- In the form's responses overview, click the arrow next to Open results in Excel and choose Download a copy.
- The first columns are each respondent's ID, start and completion times, email address and name. The import uses the ID and leaves out the email address and name.
Qualtrics#
- On the Data & Analysis tab, click Export & Import, then Export Data. Choose CSV or Excel, and Use choice text, so that closed answers come through as words rather than numbers.
- Qualtrics writes two extra header rows, with the question wording and its import IDs. Causal Map recognises them, and keeps the question wording with each answer.
SurveyMonkey#
- In Analyze results, click Export, then New export. Choose Individual responses, and XLS or CSV.
- Keep the actual answer text rather than numerical values. Causal Map recognises SurveyMonkey's second header row.
Importing into Causal Map#
- In Causal Map, open a project or create one, and use Upload sources (the green + at the top left, or the Sources panel) to pick the file.
- A panel lists every column in the export, each with an example answer, how many respondents filled it in, and a first guess at its role: ID, Text, Metadata or Skip. Check the guesses and change any that are wrong.
- Press Import. The panel then reports what it did: respondents read and imported, answers imported, empty answers skipped, and anything it left out.
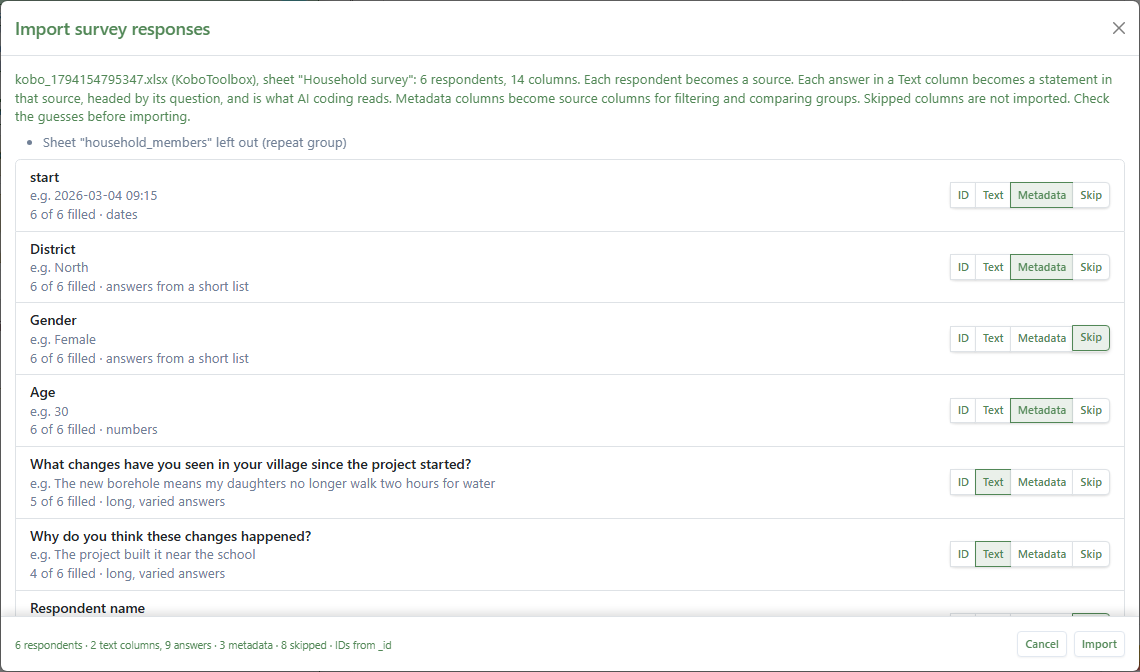
What each column becomes#
For each kind of column in a survey export, the table shows what the import makes of it unless you choose otherwise.
| In the survey export | In Causal Map |
|---|---|
| One row (one respondent) | One source, titled "Respondent" and its ID |
The tool's response ID: _id in KoboToolbox, KEY in ODK and SurveyCTO, ResponseId in Qualtrics, Respondent ID in SurveyMonkey, ID in Microsoft Forms |
The source's ID. Without one, respondents are numbered in file order |
| A text question with long, varied answers | Text: a statement in the source, headed by its question, ready for causal coding |
| A question answered from a short list (district, gender, village) | Metadata: a source column |
| A select-many question, including any separate 0/1 column for each option | Metadata |
| Numbers and dates, including start and end times | Metadata |
The survey tool's own columns, such as KoboToolbox's _uuid and _submission_time, SurveyCTO's formdef_version and review_status, and Qualtrics' Status |
Skip |
| Names, phone numbers, email addresses, IP addresses, GPS points | Skip |
| Repeat groups on sheets of their own | Left out, and named in the report |
Respondents who answered none of the Text questions are left out as well, and counted in the report: a source with no text has nothing to code.
An example#
A made-up household survey asks "What has changed in your household's access to water in the past year?" and "Why do you think that happened?", alongside district and gender. After the import, one respondent's source reads:
question_id: What has changed in your household's access to water in the past year?
We no longer walk to the river. The new borehole is ten minutes from the house, so the girls get to school on time.

question_id: Why do you think that happened?
The water committee asked the project for a borehole at the village meeting.
The source also carries District = North and Gender = Female as source columns. Causal coding of the text, with AI or by hand, gives links such as New borehole near the house → Less time fetching water → Girls arrive at school on time and Water committee request → New borehole near the house. Put together, this one respondent's two answers already make a chain from the water committee's request to the girls arriving at school on time. Across a few hundred respondents, chains like these make the map.
Which Causal Map features answer which questions#
Once the answers are coded, these are the questions survey teams usually bring, and where to find the answers. For the coding itself, see Autocoding with AI.
- What do people say caused the changes they saw? The map, read through main drivers and main outcomes.
- How did the project lead to an outcome, step by step? Path tracing, and source tracing to keep to chains that one respondent told whole.
- Do women and men, or one district and another, tell different stories? The Factors table's Breakdown by, set to a source column such as gender or district, with Show differences for a significance test: see Comparing groups.
- Are there groups we did not plan for? Tribes groups respondents by the causal stories they tell.
- Does the evidence support our theory of change? See testing a theory of change.
- What did people say in answer to one question? Add
question_id:.*to Section Separators in the Sources panel, so that each question becomes a section you can filter on. - What lies behind a particular link? The narratives behind a link brings together the passages it was coded from.
Privacy#
Survey responses describe people, so check where they will be seen before you upload them.
- On the free plan, projects are public: anyone with the link can view them. Upload survey responses on the free plan only if they are already fit to publish. Keeping a project private needs a paid plan, starting with Private.
- Leave out what you do not need. The import skips names, contact details and GPS points by default; better still, leave them out of the export.
- Choose where the AI runs. Each project has an AI Processing Region under Edit project: Europe (EU, EEA and UK), the United States, or Global. New projects default to Europe.
Good to know#
- Only the first sheet of a workbook is read.
- Any spreadsheet with a header row and one row per respondent can be imported, whichever tool wrote it.
- CSV files are read as UTF-8.
This page was drafted by the Causal Map team with the assistance of Claude, an AI model from Anthropic; the content and judgements are our own.